| |
Título: Extracting useful information from dengue incidence data.
Autor:
José Luis Hernández Cáceres.
CECAM-ISCMH.
cacerjlh@cecam.sld.cu
Indice
general
Resumen
La mayor parte de los modelos matemáticos para epidemias de dengue son difíciles de tratar por personas con conocimientos matemáticos corrientes. Nuestro objetivo ha sido mostrar cómo un enfoque centrado en la modelación puede ser útil para la comprensión de una epidemia de dengue. Se estudió la aplicabilidad del modelo “SIR” (el más simple de los existentes para epidemias) a datos reales de incidencia de dengue. Por otra parte, se intentó caracterizar el atractor para datos de dengue en una región endémica. Se exploró la posibilidad teórica de predecir el curso de una epidemia que está en marcha a partir de sus datos iniciales. Se concluye que: 1) La aproximación propuesta por Kermack and McKendrick en el marco del modelo SIR es adecuada para caracterizar datos de incidencia de dengue. 2) Un modelo con varios focos aislados explica la apariencia “anómala” de la epidemia de dengue de La Habana (2001). 3) La identificación no lineal permitió detectar un atractor quasiperiódico en los datos de dengue en Brasil. 4) Se propone un procedimiento simple para predecir el tiempo pico de la epidemia y su valor máximo. En su conjunto, nuestros resultados sirven para ilustrar la validez de un enfoque centrado en modelos para la evaluacion de datos de incidencia de dengue.
Abstract
Most of the known mathematical models for dengue epidemics are difficult to handle by those with average mathematical skills. Our aim is to show how a modeling-centered approach can be useful for understanding a dengue epidemic. We studied the applicability of the simplest model for epidemics (the SIR model) to real dengue data sets. On the other side, an attempt to characterize attractors for dengue data from endemic regions was performed. The theoretical possibility to predict the fate of an ongoing epidemic on the basis of initial data was explored. We concluded that: 1) The approximation suggested by Kermack and McKendrick in the framework of the SIR model is a good one for dengue incidence data sets. 2) A model with several isolated foci explains the “anomalous” appearance of the Havana (2001) dengue epidemic’s data set. 3) Nonlinear identification allowed characterizing a quasiperiodic attractor in Brazil data. 4) A simple procedure is introduced to predict the time corresponding to the peak value as well as the maximal value of an ongoing epidemics.Taken together, our results served to illustrate the validity of a model-centered approach to assess dengue incidence data.

Introducción
Dengue is a major health problem across a large geographic area where about 2.5 billion people dwell.There are about 50-100 million dengue cases annually, including 250000-500000 cases of dengue haemorrhagic fever, the most severe manifestation of the disease, and 24 000 deaths (Gibbons and Vaughn, 2002; Shope,1991).
With growing population density and global warming, the situation can change only to the worst (Patz J A et al., 1998). Figure 1 with Brazil’s incidence data can serve as an illustration (Siqueira et al., 2005). Isolated, unpredictable and relatively small epidemics in late 1980’s handed over their way to the present scenario of large and sustained periodic outbursts with peaks appearing at nearly one-year intervals since mid 1990’s.
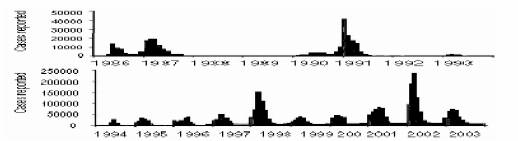
Figure 1. Brazil dengue incidence data. Notice the scale differences between upper and lower graphs. Redrawn from (Siqueira et al., 2005).
Among specialists, there is agreement that only mass vaccination can curb the dengue pandemic (Newton and Reiter, 1992; Derouich et al, 2003). Yet, we still lack a vaccine, and there is not certainty regarding its affordability to common people when it will be produced. Therefore, alternative approaches should be pondered.
Several decades of experience with epidemic research have shown that mathematical models may not always be disparate from reality, but from time to time they can be useful (Stark and Hardy, 2003). The present paper is an attempt to illustrate, on the basis of available incidence data, how a modeling-centered approach can help in understanding dengue epidemics.
Mathematical models for epidemics
Mechanistic models have a long history of almost 80 years (Kermack and McKendrick, 1927). With developments in nonlinear science since early 1980’s, analysis of epidemics using nonlinear identification tools attracted the attention of mathematicians as well (Sugihara G and May, 1990; Ellner et al., 1998; Stark and Hardy, 2003; Schwartz et al., 2004; Hernández Cáceres et al, 2006).
Mechanistic models
Currently, a multiplicity of models for specific epidemics can be found in literature (see e.g. Bjørnstad, 2002). With almost no exceptions, they may be regarded as variants of a basic proposal developed during the 1920’s: the so called SIR (“Susceptible, Infected and Removed”) model.
In this “simple” case, susceptible individuals entering into contact with infected ones have a certain chance to become themselves infected. Once infected, individuals further are “removed” from the disease transmission chain. People become both noninfectant and noninfectable due to different possible mechanisms: end of the disease with acquired immunity, death, quarantine, etc.
Schematically the SIR model is represented with three compartments and arrows corresponding to allowed transitions. Possibilities to transit from one compatment into another are quantified via corresponding rate constants (a and r):

This scheme has its mathematical counterpart in the following dynamical system:
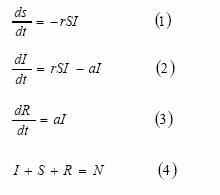
Where N is the total number of individuals. From (2), it is easy to see that for an epidemic to start the following condition must be granted:
dI/dt>0,
Hence,
rS0I-aI>0
I(rSo –a)>0
Thus, since I>0, for having an epidemic the amount of susceptibles at the beginning must be higher than the quantity 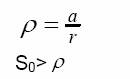
The system (1-4) contains nonlinearities, and its treatment requires significant mathematical expertise. Details about ways for finding a solution appear in the textbook by Defares and Sneddon (1970). Kermack and McKendrick (1927) showed that if the epidemic is “small” it means that (I<<N), then the following approximation is valid for the “removal” rate (see Murray (1990) for details).
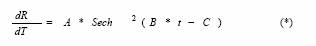
Where the constants A,B,C>0. All these three parameters are related to the constants of the model (1-4).
In particular,
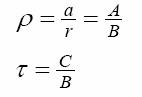
Being  the time at which the maximal value is attained. the time at which the maximal value is attained.
In modelling, simplicity is always advantageous, and thus recommendable. In this particular case, the possibility to fit real data with the expression (*) would make available an easier and better interpretable analysis. However, the validity of this approximation for dengue data needs to be verified.
Numerical output of a dengue model.
In 2003, Derouich et al proposed a model for dengue fever that incorporates both human and mosquito infection and their interactions (see figure 2 for a schematic version of their model).
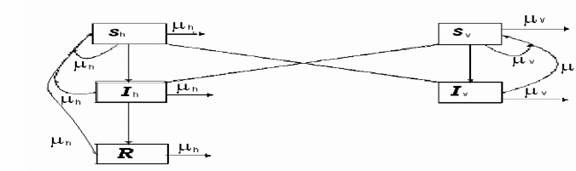
Figure 2. Scheme for the model for dengue fever developed by Derouich et al (2003).
The full model developed by Derouich et al cannot be treated analytically. We compared an output of the model’s numerical solution for the rate of removed (performed by those authors) with the approximation proposed by Kermack and McKendrick (1927). A good fit quality was attained, since more than 99% of the variance was explained by the expression (see figure 3).
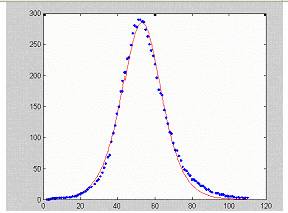
Figure 3. Fitting the numerical solution of the model by Derouich et al (isolated points) into equation (*).
This result may point to the plausibility of using (*) as a good guess for dengue data interpretation.
Behavior of real data
A further step is to check the capability of the expression (*) for fitting to real data.
In the case of a health system where notified infected individuals are accurately recorded and immediately put into quarantine, the incidence can reliably reflect the “removal rate” of the SIR model. We expect that this is true for a number of coutries in the risk area where the national health systems are suitably structured. As figures 4(a-c) show, real dengue incidence data from different origin also can be approximated with the formula proposed by Kermack and McKendrick (1927).
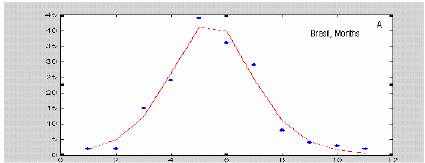 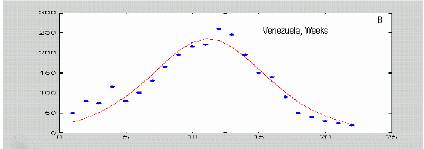 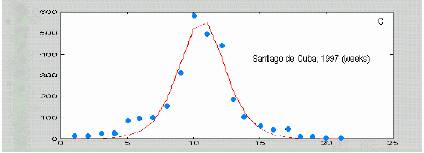
Figure 4. Dengue data from different sources fitted with equation (*). Isolated dots correspond to real data, smooth lines are the best fit to (*) Original data were published at papers by Siqueira et al., 2005; Hayes et al., 2003; and Kouri et al 1998.
Departures from the classical scenario: Havana (2001)
In spite of good accord between some data and theory, disagreements with theoretical expectations can also be found. This is the case of the Havana dengue epidemic (2001). The poor goodness of fit is apparent from figure 5a. An explanation for this departure may be in the inadequacy of the SIR model to mimic the mechanisms in force during Havana epidemic. However, this does not seem to be the case, since this discrepancy was not at all parts of the curve: there was an excellent agreement between theory and the initial phase of the outbreak (figure 5b).
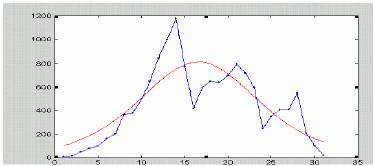
Figure 5a. Data for Havana (2001) dengue epidemic (Pelaez et al, 2004). Irregular line corresponds to real data, smooth line is the fit with (*).
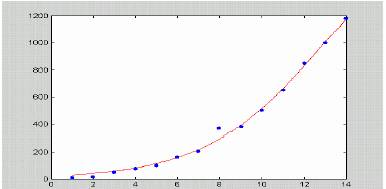
Figure 5b. Fit of the initial, rising phase of the data from 5a to the expression (*). More than 99% of the variance was theoretically explained.
Havana is a city with more than 2 million residents. Characteristic distances in Havana are large enough for considering the possibility of spreading waves to develop during the epidemics. Theory (see Murray, 2000) shows that if S0> traveling waves will appear, and the epidemic would propagate at a speed equal to traveling waves will appear, and the epidemic would propagate at a speed equal to
V = 2(1-/S0)^1/2
The value of S0 estimated from the curve in figure 5b is 8531. In a circular area with a diameter of 1.25 Km (surface area close to 5 Km2) it is expected to find a number of susceptibles twice as large. Thus the epidemic would propagate at 1.7 Km/week.
The densely populated core of Havana may be roughly represented as being nearly circular with a diameter of 30 Km (where ca. 1 400 000 people live). Thus the front can be expected to move during 9 weeks expanding as a concentric wave. Figure 6 gives us an estimate of what should be expected from this uncontrolled propagation. This gives a number of 825292 cases (58%) of the population in the area. Being our simplifications too rough, these figures should be taken cautiously; however, they do not seem to be far from the truth, since during the 1978-1979 epidemics about 25% of the Cuban population was affected. In general, it is supposed that outbreaks in urban areas infested with dengue's primary mosquito vector, Aedes aegypti, can involve up to 70-80% of the populations (Gibbons, 2002).
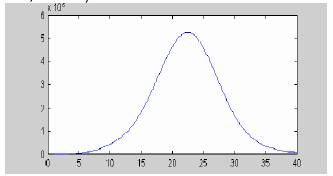
Figure 6. Simulation of the uncontrolled propagation case.
Data from figure 5a are differing from those in figure 6 both quantitatively and qualitatively. Thus a propagating wave mechanism does not seem to be a plausible explanation to observed Havana data. We hypothesize that instead of a true propagation, minor scattered local epidemic foci appeared during the Havana (2001) epidemics. As documented by Pelaez et al (2004), the epidemics started at Playa municipality (most probably due to imported infected(s) from endemic overseas areas). Six weeks later it appeared at Arroyo Naranjo, and further at Cerro, Plaza and Diez de Octubre (week 12), followed by outbursts in other municipalities at the weeks 14th and 18th.
Thus, Havana data may be the result of a superposition of several foci. We readapted the expression (*) to the case of several epidemics with moments of onset at different fixed moments (1, 6, 12, 14, 18) and identical values of B and C for each peak. The amplitudes were allowed to change to fit into data. The result of the approximation is shown in figure 8a. An attempt to separate individual peaks via stepwise estimation initially with raw data and then with residuals is illustrated in figures 7b-7c. as shown, at least 4 local epidemics are clearly identifiable using this approach.
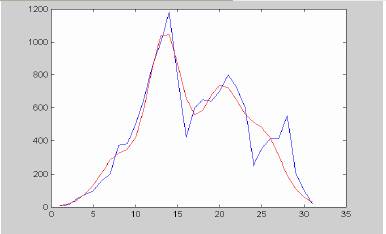
Figure 7a. Havana data approximated according to the multiple foci model. Compare with figure 5a.
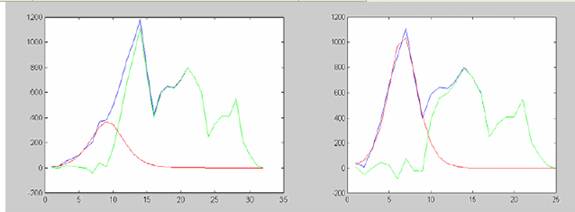
Fig 7b-c. Result of stepwise estimation of independent epidemics. Apparently the epidemics starting at Playa was of relatively low amplitude and longer duration (8b) if compared with that starting at the most densely populated municipalities (8c). The residual in 8c suggest about the epidemic at Guanabacoa, Regla and Cotorro, starting on the 18th week respect to the start. Apparently, a new focus appeared aroud week 26th
.
As appreciable, this hypothesis yields a much better fit. Higher agreement apparently can be found if data were taken with larger details and a smaller number of parameters were hold fixed.
Thus, Havana data cannot be regarded as an evidence for an anomalous mechanism, but rather as the result of a very efficient strategy to curb the spread of the epidemic across the city. If we compare the number of real cases (~15000) with the expectations for an uncontrolled spread, a huge number of persons were prevented from the disease.
Data from enmdemic regions. Brasil (1994-2003)
Kernel nonlinear identification has been used to characterize the attractors in epidemics time series. This is particularly suitable when the data show periodicities (Sugihara and May, 1990; Hernández Cáceres et al, 2006). We applied a kernel autoregressive model to the data from Brazil (See Hernandez Cáceres et al, 2006 for details about the method). Our results suggest the presence of a quasiperiodic attractor (figure 9). The period of bursts is 11 months, extremely short if compared to the values of about 4 years at the previous decade.
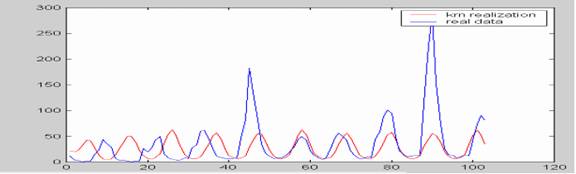
Figure 8. Application of kernel nonlinear identification analysis to brazil dengue data.
Can we predict the severity of an epidemic from initial data?
Approximating data to nonlinear expressions requires that the amount of points introduced must be much larger than the number of parameters. Time sampling, noise presence, etc., may affect the estimation. In the case of the expression we are dealing with, our results with both real and simulated data showed that it is not possible to obtain reliable estimates of the parameters of the expression (*) if only data points corresponding to the first half of the rising phase are taken for estimation, This is not surprising due to its nonlinear nature. At the same time, it is important for health providers to have good forecasts about an ongoing epidemic. We expect that transforming the data in such a way that a linear expression will appear may help to this purpose.
The rationale of our procedure is based on the Taylor decomposition of the hyperbolic sinus (the reciprocal of the hyperbolic secant)
Sin(x)=1+x2/2!+x4/4!+…
Making the suitable approximations, and denoting incidence by “Y”, one comes to:
Y -1/4=~ N*t-P (**)
and t=P/N.
Once t has been estimated, it is possible to predict the maximal value at the peak as the reciprocal to the fourth power of the value estimated for (**) when t is a fraction of t.
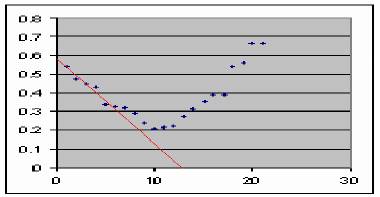
Figure 9. Predicting the fate of an epidemic. Santiago de Cuba data (Kouri et al, 1998).
The method is illustrated in figure 9. The peak is predicted to be at 12, whereas real data suggest a value between 10 and 12. Even when more points fit to the line, using only the first 4 data points are enough for drawing a reliable trace. On the other hand, the value corresponding to the maximal value is at 8 (67% of the estimate of t. We analyzed this method for a data set with 1 simulated curve and 5 curves from real epidemics from literature. The results are summarized in table I.
| Data |
t
real |
t
est |
%dif |
t
max |
t max/ t est (%) |
Sampling |
| Venezuela |
15 |
13 |
15 |
9 |
60 |
Weeks |
| Theoretical model. |
50 |
50 |
0 |
35 |
70 |
Days |
| Santiago de Cuba |
11 |
12 |
9 |
9 |
75 |
Weeks |
| Havana |
12 |
12 |
0 |
9 |
75 |
Weeks |
| El Salvador |
8 |
9 |
13 |
6 |
67 |
Weeks |
| Brazil |
6 |
8 |
25 |
5 |
67 |
Months |
Table I. Comparison of real data with predictions of (**).
As data from table I revealed, as average, a 10% difference is obtained for estimates of t max. The time corresponding (t max) is expected as average at 70% of t est.
This approach is particularly useful if data are collected weekly or even with a shorter sampling time. Since only 4 data points of an epidemic are required, this can provide reliable estimates of what is expected for about 2 months ahead.
Discussion.
Our results revealed that dengue incidence data as well as output of specific models for dengue can be reliably described with the expression proposed for Murray as an approximation for the case of the basic SIR model. This nicely simplifies data treatment and interpretation. On the other hand nonlinear estimation methods seem to provide useful information when dengue becomes endemic in a given region. The sad experience with Brazil in recent years points to the idea that this is not an odd possibility.
On the other hand, we proposed a method to predict the fate of a starting epidemic. It would be interesting to check its reliability in real field conditions.
An apparent corollary from our studies is that for proper handling of data, these must be properly sampled at both spatial and temporal scales. As our computations revealed, a dengue epidemic can appear in an urban area with nearly 5 Km2. Thus a city like Havana could be sampled into about 100 sectors. This is the approximate number of health areas into which the city’s health administration is divided to. Sampling at larger scales would mean computing at the same time both local epidemics and propagating waves. As result, if spreading does exist, we obtain wider and taller peaks. This seems to be the case of Brazilian bursts that last for about one year.
Regarding time sampling, even when daily data may be unrealistic, to try to check our predictions with data taken every 3 days would be advised.
Analysis of Havana data led us to another matter of practical importance: How to assess the impact of a certain health action? In literature there are attempts to address these issues (Kaninda et al, 2000). It seems that the possibility for an epidemic to spread has not been thoughtfully considered in most of those studies.
Taken together, our results served to illustrate the validity of a model-centered approach to assess dengue incidence data.
Conclusiones
- The approximation suggested by Murray (1990) in the framework of the SIR model is a good one for both specific models of dengue, as well as for real dengue incidence data sets.
- The model with several isolated foci explains Havana data better than the classical SIR scenario.
- Nonlinear identification allowed characterizing a quasiperiodic attractor in Brazil data.
- Using a very simple procedure it is possible to predict the time corresponding to the peak value as well as the maximal value of an ongoing epidemics.
Bibliografía
-
Bjørnstad ON, Finkenstäd, B, and Grenfell BT. (2002) Dynamics of Measles Epidemics: Estimating Scaling of Transmission Rates using a Time Series SIR Model. Ecological Monographs 72 169-184.
- Defares J G, Sneddon I N. The mathematics of Biology and Medicine. Editora Revolucionaria. La Habana, 1970.
- Derouich M, Boutayeband A, Twizell EH. A model of dengue fever. BioMedical Engineering OnLine 2003, 2:4.
- Ellner S P, Bailey B A, Bobashev G V, Gallant A R, Grenfell B T, Nychka D W. Noise and Nonlinearity in Measles Epidemics: Combining Mechanistic and Statistical Approaches to Population Modeling. American Naturalist, Vol. 151, No. 5 (May, 1998) , pp. 425-440.
- Gibbons R V and Vaughn D W. Dengue: an escalating problem BMJ 2002;324;1563-1566.
- Hayes J M, Garcia-Rivera E, Flores-Reyna R, Suarez-Rangel G, Rodriguez-Mata T, Coto-Portillo R, Baltrons-Orellana R, Mendoza-Rodriguez E, Fuentes de Garay B, Jubis-Estrada J, Hernandez-Argueta R, Biggerstaff B J, Rigau-Perez J G. Risk factors for infection during a severe dengue outbreak in El Salvador in 2000. Am. J. Trop. Med. Hyg., 69(6), 2003, pp. 629–633.
- Hernández Cáceres JL, Hernández Martínez L, Pérez Monzón M, and García Domínguez L. Nonlinear properties of measles epidemic data assessed with a Kernel Nonparametric Identification approach. Elect J. Biomedicine, No1, 2006.
- Kaninda A V, Berlanguer F, Lewis R, Btchassi E, Aplouan A, Yakoua Y, Paquet C. Effectivenes of incidence tresholds for detection and control of mengococcal meningitis epidemics in Northern Togo. Int J Epidemiol, 2000, 29, 933-940.
- Kermack, W. O., McKendrick, A. G. Contributions to the mathematical theory of epidemics. Proc. Royal Soc. A, 115, 700-721 (1927).
- Kouri G, Guzmán MG, Valdés L, Carbonell I, Rosario D, Vázquez S, S, Laferte, J, Delgado J, Cabrera MV . Reemergence of dengue in Cuba: a 1997 epidemic in Santiago de Cuba. Emerg Infect Dis 1998;4:89–92.
- Murray J D. Mathemativcal Biology. Springer Verlag. BerlinHeidelberg. 2000.
- Newton EA, Reiter P.A model of the transmission of dengue fever with an evaluation of the impact of ultra-low volume (ULV) insecticide applications on dengue epidemics. Am J Trop Med Hyg. 1992 Dec;47(6):709-20.
- Patz J A, Martens W J M, Focks D A, Jetten T H. Dengue Fever Epidemic Potential as Projected by General Circulation Models of Global Climate Change. Environ Health Perspect 106:147-153 (1998).
- Peláez O, Guzmán MG, Kourí G, Pérez R, San Martín JL, Vázquez S, Rosario D, Mora R, Quintana I, Bisset J, Cancio R, Masa AM, Castro O, González D, Avila LC, Rodríguez R, Alvarez M, Pelegrino JL, Bernardo L, and Prado I. Dengue 3 Epidemic, Havana, 2001.Emerg Infect Dis [serial online] 2004 April [date cited]. Available from: http://www.cdc.gov/ncidod/EID/vol10no4/03-0271.htm.
- Schwartz I B, Billings L, Bollt E M. Dynamical epidemic suppression using stochastic prediction and control. Physical Review E 70 (4): Art. No. 046220. OCT 2004.
- Shope, R. E. 1991. Global climate change and infectious diseases. Environmental Health Perspectives 96: 171-74.
- Siqueira JB Jr, Martelli CMT, Coelho GE, da Rocha Simplício AC, Hatch DL.. Dengue and dengue hemorrhagic fever, Brazil, 1981–2002. Emerg Infect Dis [serial on the Internet]. 2005 Jan [date cited]. Available from http://www.cdc.gov/ncidod/EID/vol11no01/03-1091.htm.
- Stark J and Hardy K. Chaos. Useful at last? Science 301, 1192-1193, 2003.
- Sugihara G and May R M, Nonlinear forecasting as a way of distinguishing chaos from measurement error in time series, Nature, 344 (1990), 734-741.
|